We are bounded in a nutshell of Infinite space:
Blog Post #25, Worksheet # 7.2, Problem #5: Gas, gas everywhere and every-when
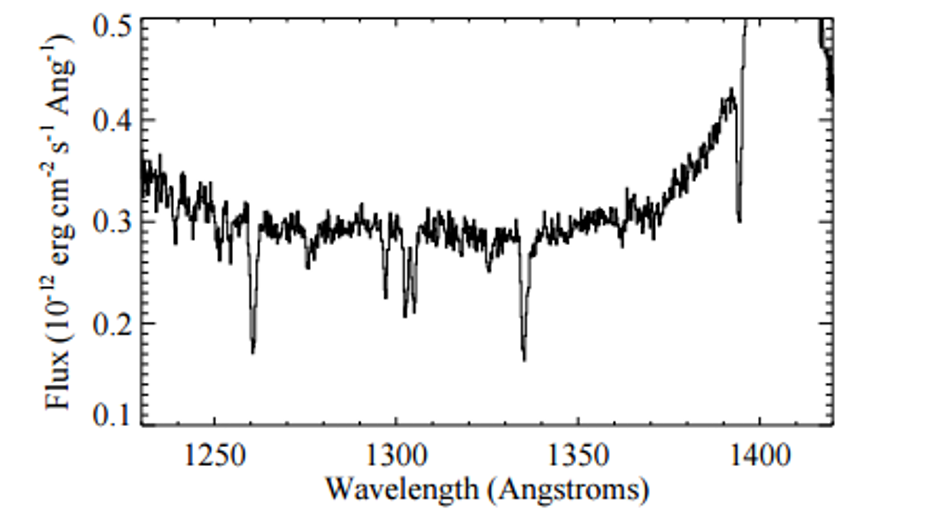
5. You may also
have noticed some weak “dips” (or absorption features) in the spectrum:
(a) Suggest some
plausible origins for these features. By way of inspiration, you may want to
consider what might occur if the bright light from this quasar’s accretion disk
encounters some gaseous material on its way to Earth. That gaseous material
will definitely contain hydrogen, and those hydrogen atoms will probably have
electrons occupying the lowest allowed energy state.
(b) A spectrum of
a different quasar is shown below. Assuming the strongest emission line you see
here is due to \(L\gamma\alpha\), what is the
approximate red-shift of this object?

(c) What is the
most noticeable difference between this spectrum and the spectrum of 3C 273?
What conclusion might we draw regarding the incidence of gas in the early
Universe as compared to the nearby Universe?
(a) These features could be caused
by the way the elements found in the gas of the interstellar medium have the
ability, like all atoms, to absorb energy and thus dim the light we receive
from the original source. However, if we take these absorption numbers, we can
then find the exact composition of the interstellar gas, since only specific
wavelengths can be absorbed and used within the internal mechanics of the atom.
(b) As to the Red Shift of this new emission spectrum, the process is almost identical to the process made for problem #4. Knowing the Red Shift Equation, we have: \[\frac{\lambda_{observed} - \lambda_{emitted}}{\lambda_{emitted}} = z ,\] which is just a matter of plugging in the emitted wavelength of hydrogen, since the peak of this spectrum is the hydrogen emission (as the problem establishes), which is 1215.67 \(\dot{A}\). The Other value would be the wavelength of the max flux, which is 5625 Angstroms. So the equation is:
\[\frac{5625 \dot{A} - 1215.67 \dot{A}}{1215.67 \dot{A}} = z, \] \[ z =3.627, \] which is the Red Shift of this emission spectrum.
\[\frac{5625 \dot{A} - 1215.67 \dot{A}}{1215.67 \dot{A}} = z, \] \[ z =3.627, \] which is the Red Shift of this emission spectrum.
(c) Considering both the emission
spectrum we just analyzed and the spectrum for 3C 273, the one we studied
previously, there seems to be a major difference. The emission is shifted for
the fact of the Red Shift as a result of the quasar being farther away,
therefore faster from our perspective, and thus older. But the clear
distinction is how the 3C 273 graph had much fewer dips during the beginning of
the spectra, while the new quasar is absolutely full of dips before it rises to
the max Flux. This helps to show that this galaxy, being farther away and older
than other stars, hints at how the universe was long ago: full of gas, unformed
and ready to be turned into the next generations of stars and planets.
Great conclusion! Notice that z is greater than 1, which shows the naive Doppler shift interpretation of redshift is no longer valid (why?). Cosmological redshift is really an outcome of the fundamental expansion of the cosmos itself.
ReplyDeleteWhile i agree that the dip features are attributed to absorption by stuff in the clouds between us and the quasar, the elements doing the absorption is almost certainly hydrogen (by far the most abundant), and the wavelength range we are zoomed into suggests that the features come from the *same* transition wavelength (which transition and why?), and only shifted with respect to each other because of the differing velocities and redshifts of the intervening material.
4.5